- We’re on your favourite socials!


Search for best colleges, Courses, Exams and Education updates

Comprehension:Study the bar-graph given below carefully and answer the questions. Bar-graph given below shows the number of packets of bread sold by five stores of two types i.e. multi grain and whole wheat.
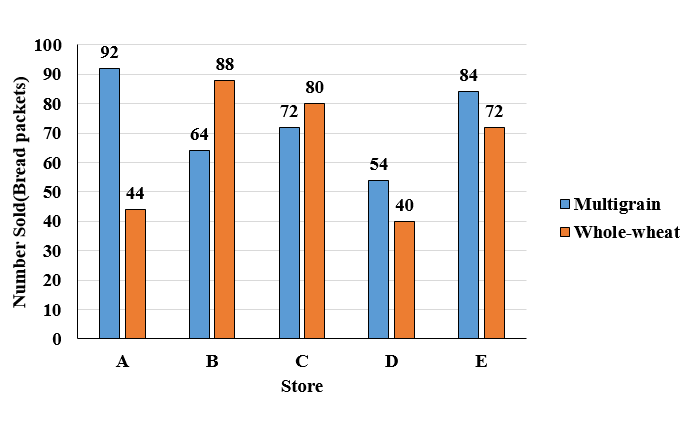
If another store 'F' sold number of multigrain packets which is average number of multigrain packets sold by stores 'C', 'D' and 'E' and average number of whole-wheat packets sold by stores 'A' and 'E'. If store 'B'sold each packet at ₹ 240 and store 'F'sold each packet at 20% more than that of 'B', then total revenue collected by store 'F' is.
The total number of packets sold by store 'C' is approximately what percent more or less than the total number of packets sold by store 'E' ?
Multigrain packets sold by stores 'A' and 'B' together are what percent more or less than whole-wheat packets sold by stores 'C' and 'D' together ?
Study the given pie charts carefully to answer the questions that follows.
Comprehension:
Break up of number of students studying in different specialization of management college and the number of students who recently got placed in each specialization.
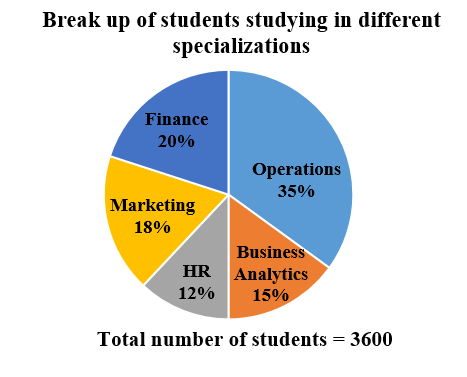
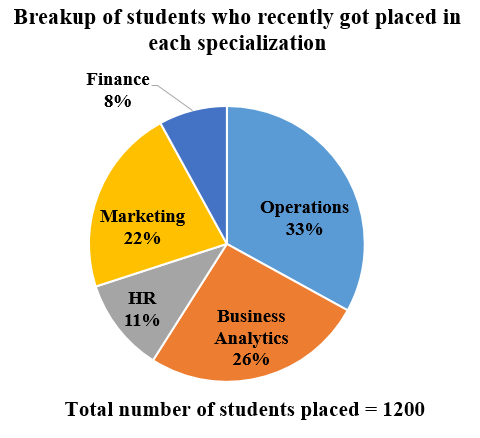
The total number of students who got placed from all the specialization together was what percentage of total number of students pursuing specialization in operations, market ing and finance collectively?
What is the difference between the total number of students pursuing specialization in Business Analytics and HR combined and the number of student who got placed from marketing specialization and finance specialization combined?
The number of students who got placed from the HR specialization was what percent of the total number of students studying in that specialization?
Match List I with List II :
Choose the correct answer from the options given below :
Study the pie chart and table and answer the questions

Distribution of total no. of Kurtis (cotton and linen) sold by six different stores in 2016, where total kurtis sold are 84,000.
Number of kurtis (linen and cotton) sold by store D is what percent more than the number of linen kurtis sold by store B?
What is the difference between average number of linen kurtis sold by stores D and E together and average number of cotton kurtis sold by the same stores together?
What is the respective ratio between number of kurtis (linen and cotton) sold by store C and number of linen kurtis sold by store F?
Match List I with List II :
Choose the correct answer from the options given below :
Following 3 questions are based on the information given below.
There are 240 students in an engineering college. Each student opted for exactly one of
three specialisations among Computer Science, Mechanical and Electronics. The total
number of students who opted for Computer Science and Electronics is equal to the
number of students who opted for Mechanical. 42·5 % students who opted for Mechanical
are girls. The number of girls who opted for Computer Science is one-third the number of
boys who opted for Mechanical. The difference between the number of boys who opted for
Electronics and the number of girls who opted for Computer Science is equal to the
difference between the number of boys who opted for Computer Science and the number
of girls who opted for Electronics. The number of girls who opted for Electronics is 28.
The total number of girls in the Engineering College is
The number of girls who opted Mechanical is how much percent of number of students who opted Electronics?
By what percent is the number of boys who opted for Mechanical is more than the total number of students who opted for Electronics?
Match List-I with List-II
Choose the correct answer from the options given below :
The following table shows the percentage of Cricket players and scored runs by them in three different tournaments P, Q and R. Total number of players is 300 and all the 300 players played all the matches in each tournament. Based on the data in the table; answer-the questions 1-5.
Tournament-wise Percentage of Players scoring runs

Number of players who scored less than or equal to 40 runs in tournament Q is _____ % more than the number of players who scored more than 60 runs in tournament P and Q together.
what is the ratio between the number of players who scored more than 60 runs in tournament Q to the number of players who scored less than or equal to 20 runs in tournaments Q and R together?
What is the total number of players who scored more than 60 runs in all the three tournaments?
If L is the number of players who scored more than 40 runs in tournament P and M is the number of players who scored less than or equal to 40 runs in tournament R, then M - L = _________.
Average number of players who scored more than 20 runs in all the three tournaments is
Want to know more about CMAT
Typical response between 24-48 hours
Get personalized response
Free of Cost
Access to community


